

The Charts Tab
The Charts tab is the second tab of the Patient Workspace. It lists the patient’s charts, newest first, one line per chart. Each line has a row of small buttons for what you can do with that chart without opening it.
A chart holds the notes from one visit. To start a new one, click New Chart in the header bar at the top of the workspace. Creating A New Chart explains the other ways.
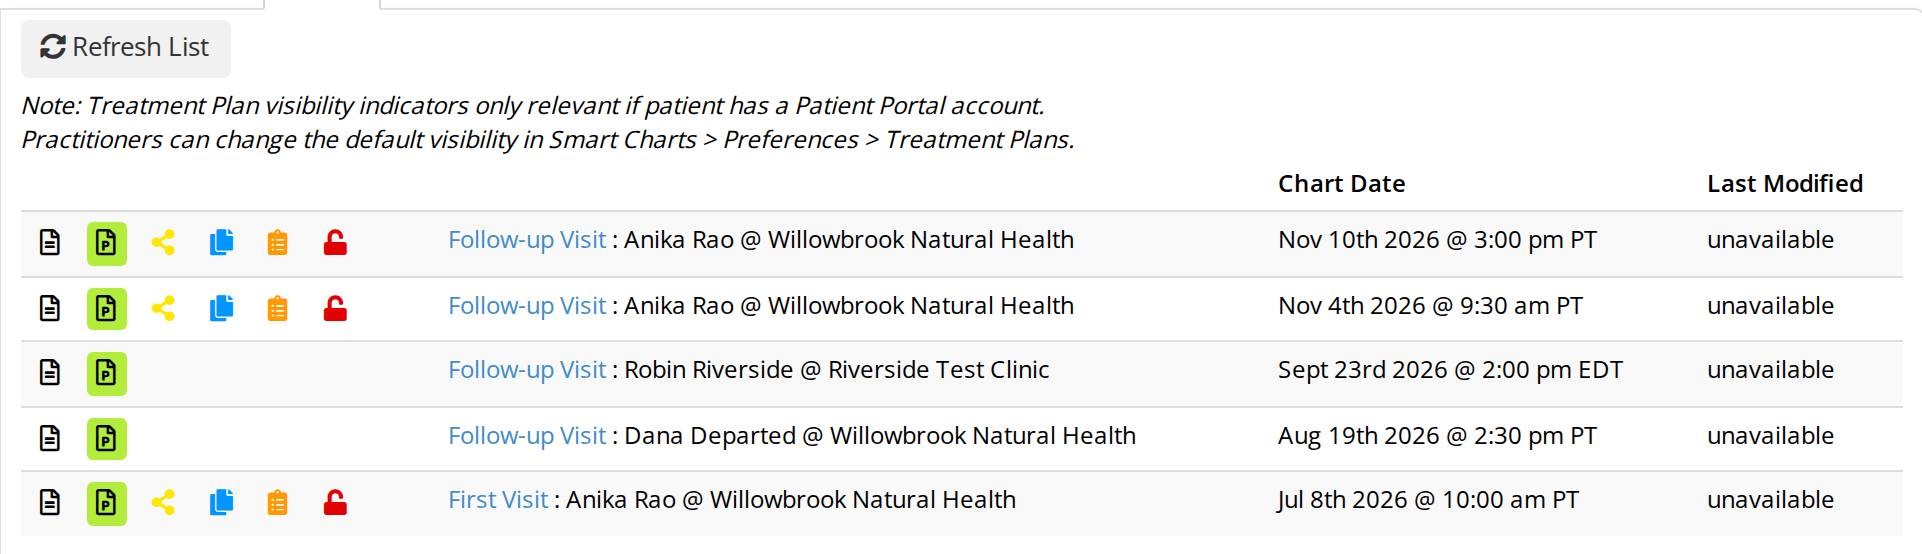
The Charts tab. Your own charts have a full row of buttons. Charts written by other practitioners have only the buttons to view the chart and its treatment plan.
What Each Line Shows
- The chart type and who wrote it, such as Follow-up Visit : Anika Rao @ Willowbrook Natural Health. Click the chart type to view the chart.
- Chart Date, the date and time of the visit, with the time zone the chart was written in, such as PT for Pacific Time.
- Last Modified, when the chart was last changed. It reads unavailable when OutSmart has no record of a change.
When a chart is waiting for a supervisor to review it, the line also says so. Charting For Students Or Interns explains reviews.
Which charts are listed. As a practitioner, you see your own charts for this patient and the charts other practitioners have shared with you. At a Collaborative Clinic, you also see the charts written by the other practitioners at the clinic.
The Buttons On A Chart’s Line
Hover over a button to see its name.
| Button | What it does |
|---|---|
| View Chart, a document | Opens the whole chart, ready to read or print, in a new window |
| View Treatment Plan, a coloured button | Opens the treatment plan from the chart in a new window. The colour shows whether the patient can see it in the patient portal, as the next section explains |
| Share Chart, yellow | Shares the chart with a colleague. See Sharing Charts With Colleagues |
| Duplicate Chart, blue | Makes an exact copy of the chart, which you can change to suit a new visit. The copy opens for editing |
| Convert to Smart Template, orange | Makes a copy of the chart as a Smart Template. The chart itself is not changed. See Smart Templates |
| Delete Chart, a red bin | Deletes the chart after you confirm. Shown only on charts that are not locked. See Deleting A Chart |
| Continue Editing Chart, a green arrow | Opens the chart so you can carry on writing it. Shown only on charts that are not locked |
| Unlock Chart, a red open padlock | Unlocks a locked chart after you confirm, then opens it for editing. See Locking And Unlocking A Chart |
Share, Duplicate, Convert to Smart Template, Delete, Continue Editing and Unlock appear only on charts you wrote. On a colleague’s chart you can view the chart and its treatment plan.
Duplicate Chart, Convert to Smart Template and Unlock Chart each ask you to confirm first. The message for Unlock Chart notes that every change to a chart’s status is logged.
The Treatment Plan Button’s Colour
The colour of the View Treatment Plan button tells you whether the patient can see that chart’s treatment plan in the patient portal.
| Colour | What it means |
|---|---|
| Green | Visible in the patient portal |
| Yellow | Visible in the patient portal once the chart is locked |
| Pink | Not visible in the patient portal |
Hovering over the button gives the same answer in words, such as View Treatment Plan (Visible In Patient Portal).
The colour matters only when the patient has a patient portal account with full access, as the note above the list says. Each practitioner chooses the default in Chart Preferences, and can change it on a single chart. Patient Treatment Plans explains both.
Deleted Charts
When the patient has deleted charts, a grey button above the list reads Show 1 Deleted Chart, or the number of deleted charts the patient has. Click it to list them in red, each marked (Deleted). The button then reads Hide 1 Deleted Chart.
For practitioners, a deleted chart’s line has a Recover Chart button, a curved arrow. It puts the chart back in the list as an unlocked chart.
Refresh List at the top of the tab loads the list again, which shows a chart a colleague has just written or shared.
What Admin Staff See
Office admins see the charts written at the offices they belong to. A chart’s type is shown as plain text rather than a link, and the line has the View Treatment Plan button. An admin also has the Share Chart button on a chart when both the admin and the practitioner who wrote it still work at the office where it was written.
A long list loads in parts for admins. Click Load more charts at the bottom to see older charts.
Related Pages
- Patient Workspace Overview. The page this tab sits on, and the New Chart button.
- Creating A New Chart. Every way to start a chart.
- Locking And Unlocking A Chart. What locking a chart does.
- Sharing Charts With Colleagues. What the Share Chart button does.
- Patient Treatment Plans. What the patient sees in the portal.